Why the Future of Insurance...
15 Oct 2026


Microsoft Power BI and Copilot are revolutionizing business intelligence by intertwining generative AI with intuitive analytics. Applying natural language queries, it transforms raw data into actionable insights, thus rendering complex analytics easy for all to do. This hybrid enables users of all skills to uncover trends faster, visualize data, and decide. It stands out as clear strategic clarity amidst choking data, thereby pointing in the direction of agility and democratization of data-driven decision-making.
Power BI Copilot unlocks the complexity of BI by enabling natural language interaction with data.
One can picture a Sales Director preparing for a regional review. Rather than placing a special request with the BI team to prepare a custom report, the Sales Director can simply ask the following questions out loud to Copilot within the Power BI dashboard:
The benefits of this conversational data exploration approach for businesses are manifold:
The empowered business user now has analytical power at her/his discretion to carry out decision-making processes on a day-to-day basis. Any such arrangement fosters a culture of data literacy and encourages increased use of data.
Answers to critical business questions are provided in seconds or minutes rather than in hours or days. Decision-making cycles are thereby further shortened, allowing businesses to react to market conditions faster.
Less time spent by business users on fighting with tools or waiting for reports means they now have time for other higher-value activities. Analysts, conversely, are freed from myriad ad hoc requests and can pay attention to more complex strategic analyses.
Users become more liberal in exploring the data, asking follow-up questions, and identifying nuances and correlations through these easy-to-ask questions, something that might have gotten overlooked with traditional methods.
Power BI Copilot transforms BI from reactive to proactive by automatically surfacing hidden insights, trends, and anomalies, saving time, reducing oversight, and empowering users to discover what they didn’t know to ask.
Consider a marketing manager analyzing campaign performance data. It would perform automated analysis to:
This automated insight generation capability offers substantial business advantages:
Insights a person would have been forced to derive through endless hours or days of manual analysis are delivered into the business almost instantly so that it may act quickly on an opportunity or resolve an issue faster.
Automated analysis could help confirm confirmation biases-an analyst might be interested only in those pieces of data that fit in with his pre-existing ideas. Copilot scans the data for statistically-significant patterns with objective view.
It empowers users with vast diagnostic capabilities who might or might not have the analytical expertise to go out and get a grasp of the ‘why’ behind the numbers presented to them in their reports.
In a way, Copilot automates the ‘what happened?’ and ‘why?’ finding processes so that business users and analysts can concentrate on the ‘what should we do next?’ component-I would rather call it our action plan from insight.
Power BI Copilot simplifies data storytelling by generating natural language summaries from visuals and dashboards. It helps users, especially non-technical ones, quickly grasp insights, ensures consistent reporting, and reduces the manual effort of crafting clear, compelling business narratives.
This automated narrative business reporting offers significant advantages:
Quite complex data becomes almost immediately simpler for the broad audience to interpret. Narratives add context, point to a few key takeaways, and reduce the cognitive load involved in reading just charts.
AI-generated narratives create a consistent voice across reporting within organizations. Then, that communication template can be used for presentations, executive summaries, and business reviews.
Report summaries getting created by automation save enormous amounts of time for analysts and report writers, allowing them to perform deeper analyses, make strategic recommendations, or build more elaborate reports.
This makes data insights accessible to people who might struggle to interpret complex visuals, encouraging more people to engage with BI reports.
Though not fully manual, these narratives are often user-editable to any degree, either to inject domain knowledge or to adjust for application in a particular tone or to an audience.
Here’s how Copilot contributes to predictive analysis and recommendations within the Power BI ecosystem: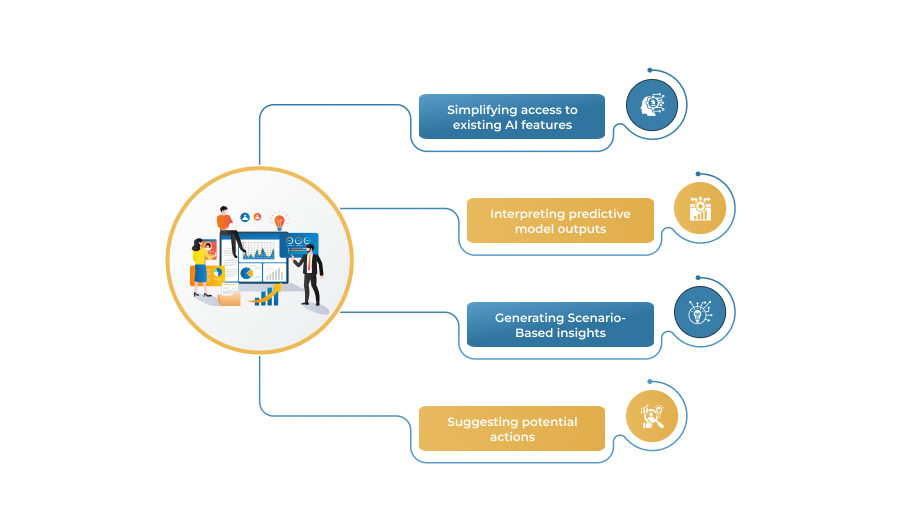
Power BI already offers alternatives-oriented features, such as forecasting in line charts, key influencer analysis (which suggests factors), and Azure Machine Learning integration. Copilot can interface these features under natural language for easier user interaction, allowing users to apply forecasting or learn about influencing factors without, you know, wading through a series of menus.
Should an organization deploy more advanced predictive models (maybe those built in Azure ML and incorporated into Power BI), with Copilot, the results become interpretable beyond mere visibility of prediction scores
Providing conversational interaction with data analysis enables users to examine future scenarios. For example, “What would be the likely impact on profit margins if our shipping costs increase by 10% next quarter?” Based on historical data and relationships stored within the model, Copilot can help simulate these changes and provide a possible glimpse into the future.
Although AI-powered analytics continues to evolve, Microsoft Copilot delivers contextual insights and actionable recommendations. As a result, organizations can make faster and more informed decisions.
For instance, Copilot may detect an expected decline in sales and explain the contributing factors. Furthermore, it can identify underperforming marketing channels and recommend appropriate actions. Therefore, businesses can optimize their sales strategy and improve overall performance.
Here’s how the combination enhances cross-data source analysis:
The business benefits of easier cross-data source analysis powered by tools like Copilot within an integrated platform like Power BI/Fabric are substantial:
Sales, marketing, service, maybe even social media data needs to be combined together to give an exhaustive coverage to understand customer interactions and journeys.
Integrating data of supply chain, manufacturing, finance, and HR enables an overall analysis of operational performance and identification of bottlenecks.
It is decided upon a comprehensive view of the landscape of business, along with the interdependencies existent between different functions.
By mixing the information about finance, operations, and market, one may be able to get an early warning of impending risk.
The integration of Copilot with Power BI marks a transformative leap in business intelligence, making data accessible to all decision-makers. By combining advanced analytics with conversational AI, it enables intuitive data exploration, automated insights, and holistic reporting across integrated sources. This shift empowers organizations to move from reactive analysis to proactive foresight. Success requires strategic alignment, data readiness, AI culture, and strong governance. Embracing Copilot + Power BI means unlocking innovation, agility, and competitive advantage. Ready to elevate your BI strategy? Contact us today to start your AI-powered data journey.
15 Oct 2026
12 Oct 2026

08 Oct 2026