From Manual Processes to Smart...
22 Oct 2026


In the competitive landscape of manufacturing, operational efficiency is non-negotiable. Businesses need real-time insights, actionable metrics, and seamless reporting to maintain their competitive edge. Tracking Overall Equipment Effectiveness (OEE) is one of the most powerful strategies to measure, analyze, and enhance production performance.
However, many businesses struggle to move from fragmented data systems to an integrated, real-time OEE monitoring environment.
Enter Power BI, Microsoft’s leading business intelligence tool that can revolutionize OEE tracking, offering interactive dashboards, predictive analytics, and a clear path to process optimization. In this blog, we explore how tracking OEE with Power BI empowers manufacturing businesses, accelerates decision-making, and drives profitability.
Overall Equipment Effectiveness is the yardstick for measuring manufacturing productivity. It means a complete way to measure manufacturing equipment in terms of its working performance during planned production time.
OEE measures good pieces produced by an organization in an interval divided by how many could have been produced during the same time frame under the assumption of perfect running of all machines and processes. This simple percentage sums up everything that matters, essentially the three critical factors as follows.
Availability measures the actual operating time compared with the planned production time. It also accounts for planned and unplanned downtime.
Common availability losses include equipment breakdowns, material shortages, changeovers, and maintenance activities that prevent equipment from operating during scheduled production hours.
Performance measures how quickly production runs compared with the equipment’s planned production speed.
Typical performance losses include slow production cycles, minor stops, and other factors that reduce equipment speed.
Quality measures the number of good units produced compared with the total number of units manufactured.
Common quality losses include defects, rework, and startup yield losses.
The complete OEE calculation multiplies these three components:
The average OEE for manufacturers is around 60%, while world-class OEE is considered to be 85% and above.

In an environment that embraces data today, OEE tracking methods like spreadsheets or manual calculations are becoming insufficient. This is why Power BI has become a solution for the best:
Power BI converts quite complex production data into truly intuitive interactive dashboards updating in real-time. This immediate view allows operations teams to prioritize action on the biggest opportunities while quickly identifying performance issues. Managers can directly go into problems as they happen rather than wait for end-of-shift or weekly reports to discover them.
Almost any data – be it PLC, SCADA, ERP, even manual entry – used by your manufacturing environment is almost certainly integrated by Power BI. Thus making it possible to look at your complete picture of manufacturing performance by eliminating information silos.
Beyond the base calculations of OEE, Power BI grants advanced analysis through:
Power BI dashboards are accessible from any device with the appropriate security credential, thus allowing all employees from management to shop floor supervisors to share and use the same trusted source of data. This visibility will encourage problem-solving across functions and improvement of aligned efforts.
Whether you are measuring OEE on a single production line or across multiple sites worldwide, Power BI scales easily to fit your needs. This ensures, at the enterprise level, that your OEE tracking solution will grow with your business.
Implementing effective OEE tracking with Power BI involves several key steps:
The foundation of accurate OEE tracking is reliable data collection. Depending on your manufacturing environment, you might leverage:
For operations with limited automation, simple data collection tools can be implemented to capture critical production metrics without significant infrastructure investments.
Power BI must be set up correctly in terms of data structure and should include:
Such an ordered structure of data brings about accurate computations of all OEE components.
Typical examples of OEE dashboards include:
The best dashboards, such as the one showcased in the Power BI community, tend to spotlight actionable insights, such as Operational Focus Areas summarizing machine-level trends, key downtime causes, and shift performance.
An alert system in Power BI may notify concerned entities when the OEE metrics go below threshold values, thus enabling timely intervention before a minor issue degenerates into a major production disturbance.
Manufacturing facilities often face several challenges when implementing OEE tracking. Here’s how Power BI addresses these common obstacles:
Many facilities struggle with inconsistent data collection methods across different machines and shifts.
With Power BI, it’s possible to transform and standardize input data from various sources to provide a data set into which an organization can entrust its OEE metrics. It can also apply rules to validate the data that will mark unusual values for further analysis and review, ensuring that every decision is made on the fact of having credible information.
Many systems can state that OEE is below target; understanding why is another story.
Power BI drill-down capabilities let users move from high-level OEE metrics to the specific factors that contributed to an OEE decrease. For instance, if availability is a problem, one can immediately see which machines and which downtime reasons contributed the most, allowing improvement activities to be focused on those areas.
Data, devoid of context, may barely lead to meaningful improvement.
Power BI dashboards can be configured to highlight the priority opportunities automatically, through, for example, “Operational Focus Areas,” which adapt to the choices made by the user. Users do not need to analyze single charts, thus allowing timely, informed decisions.
Different roles within the organization require different perspectives on OEE data.
Power BI allows for role-based dashboard views, providing executives with high-level performance trends while giving supervisors and operators the detailed information they need to drive immediate improvements. This tailored approach increases adoption and ensures everyone uses the insights appropriate for their responsibilities.
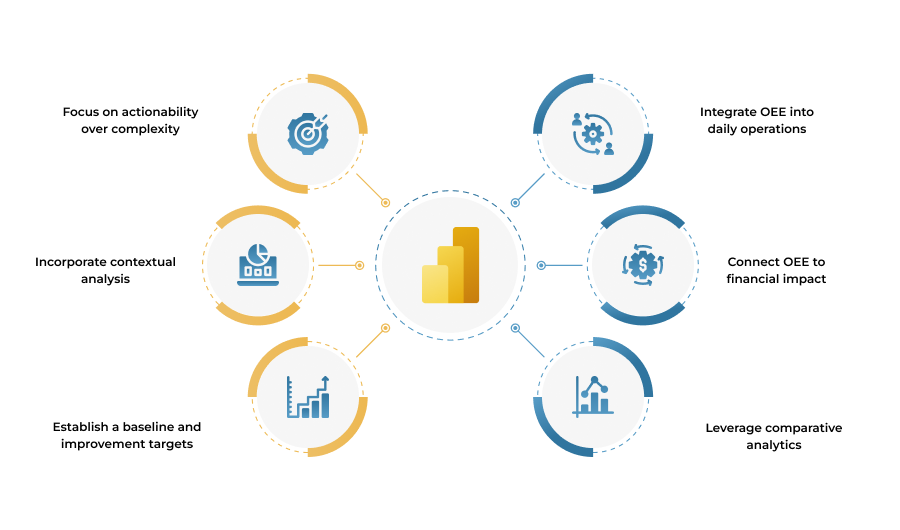
Based on successful implementations across manufacturing sectors, we recommend these proven practices:
Best OEE dashboards prioritize actionable insights without attending to needless complex visualizations. As per most manufacturing professionals, “Users ‘dislike’ graphs, or at least have difficulty interpreting even a simple bar chart” and prefer “bullet-point text highlighting focus areas.” As such, design your dashboard with actual users in mind.
OEE should never be analyzed in isolation. Your Power BI solution should enable analysis of correlations between factors: Does “a particular machine perform significantly better or worse during certain shifts,” or maybe “one machine is more susceptible to certain downtime causes”.
Start by capturing plant data over a period of a month so that you can derive your baseline OEE score. This should provide you with a grounding to set reasonable improvement targets and to track improvement. World-class manufacturers obtain OEE scores of 85% and above. Even improvements of a few percent can provide a high return on investment.
The most successful implementations integrate OEE tracking into the daily operational rhythm. Consider designing specific shift report views to share with shift leads so that accountability is created on performance trends.
In order to get maximum executive buy-in, the translation of OEE improvements into financial benefits must be made clear in your Power BI solution. For example, demonstrate how a 5% OEE improvement translates to increased capacity, reduced costs, or additional revenue potential.
Benchmark your OEE performance against peers in the industry in order to really get a picture of your existing plant performance. While data on direct competitors may be hard to come by, these industry benchmarks can provide a great deal of context for your improvement journey.
Tracking Overall Equipment Effectiveness (OEE) is no longer optional for manufacturers aiming to stay competitive. It is a vital metric that uncovers hidden inefficiencies, optimizes machine performance, and boosts profitability.
By leveraging the power of Microsoft Power BI, businesses can move from fragmented data to a unified, intelligent OEE tracking system. The result? Real-time visibility, improved decision-making, and measurable operational excellence.
Contact us today, we specialize in developing custom OEE tracking solutions using Power BI tailored to your manufacturing needs. Whether you are an SME seeking to optimize one production line or an enterprise managing multiple plants globally, our team ensures a seamless, scalable, and cost-effective implementation.
19 Oct 2026
28 Sep 2026