Why Today’s Customers Expect Insurance...
12 Oct 2026


Using Power BI, insurance executives can monitor risk, performance, and business opportunities in real time. Power BI enables the integration of data from various systems into one interactive dashboard. Insurance executives can identify trends in claims, monitor KPIs, detect fraud, and expedite data-driven decision making. With Power BI, insurance executives can streamline insurance data into actionable insights to enhance operational efficiency, minimize losses, and provide tailored customer service.
One of the persistent challenges that Insurance Businesses experience is the absence of immediate clarity for their leaders. Because of the numerous departmental reports that are inconsistent and provide information that is out of date, executives must make decisions based on fragmented data.
Data is often siloed across different systems in organizations. Separate claims, underwriting, finance, and customer service departments operate with their own data sets and reporting systems.
Without a complete understanding of the organization, leaders will struggle to identify patterns, optimize operational efficiencies, or identify opportunities for growth.
Today’s insurance organizations demand a higher level of centralized analytics to provide leaders with real-time insights into the performance of the entire organization.
Power BI is one of the most crucial business intelligence tools in the contemporary insurance sector. It provides organizations the ability to streamline extensive amounts of information and convert them to emotional dashboards and real-time analytics.
In contrast to conventional reporting tools, Power BI provides integration of several data sources and unites them in one location to provide leadership with the capability to view metrics throughout the organization.
Insurance executives gain a number of advantages thanks to the functionality of Power BI.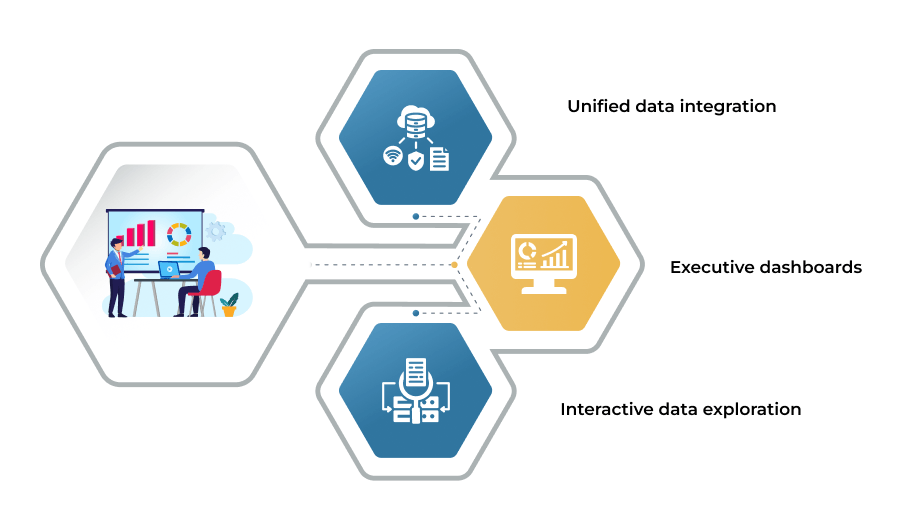
The leadership of any insurance company has an ongoing responsibility of managing risk. Executives must always assess how risk exposure impacts the company’s bottom line by product and by market.
With Power BI, insurers can assess the performance of their portfolios through the creation of dashboards that visualize the dynamics of risk.
Using Power BI analytics, executives can assess portfolio performance with metrics such as: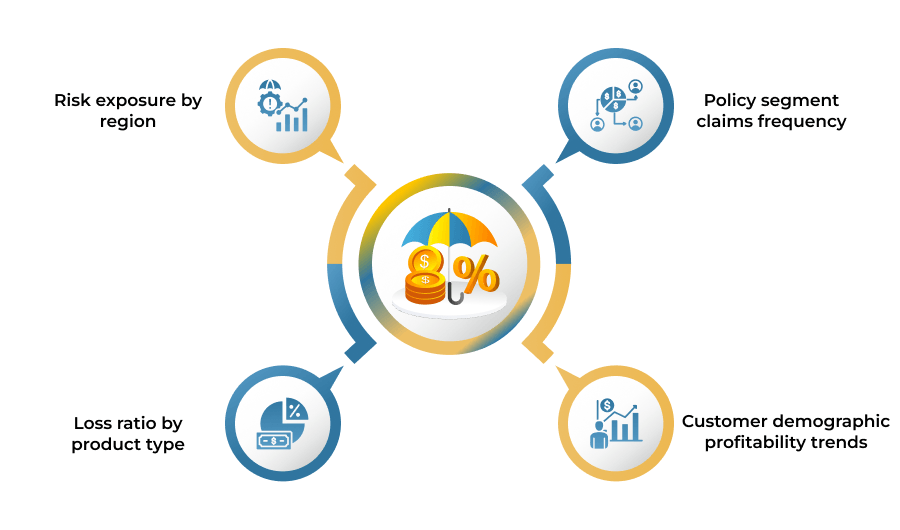
These metrics allow executives to better understand risk distribution within the organization.
For instance, certain dashboards may indicate that a product line is high revenue, but also has a claims rate that is high average. This can help leadership reposition and adjust pricing, underwriting policies, and rebalance the portfolio.
Power BI combines risk analytics and financial performance, helping insurance executives integrate profitability with risk management.
Insurance companies incur some of their largest costs through claims processing. Inefficient and unclear claims processing can lead to excessive operational costs and low customer satisfaction. Increased costs and poor satisfaction can result from impaired claims processing.
With Power BI Analytical Dashboards, Insurance Leaders can understand the handling of claims throughout the organization. Instead of using disjointed singular reports, executive leaders can access real-time insights to understand the complete claims lifecycle.
Power BI allows the management team to measure and assess the following claims performance metrics: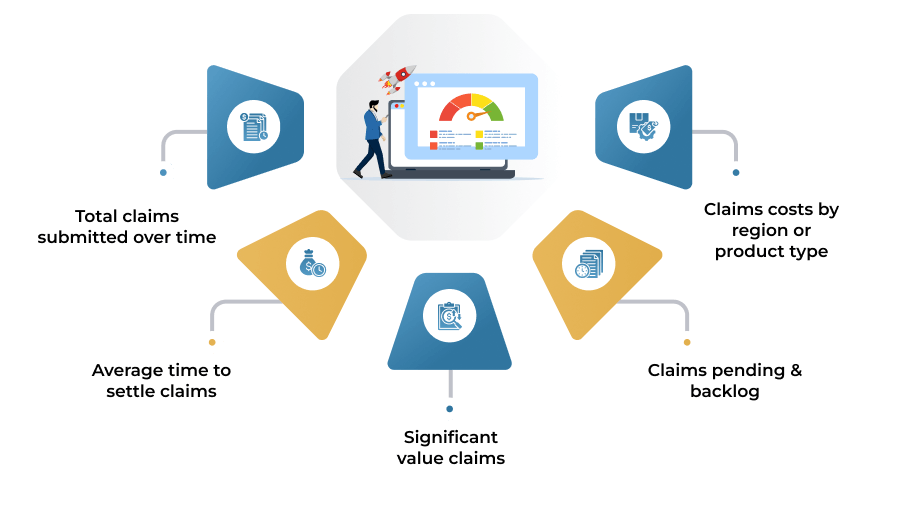
Transforming Claims Data for Operational Gains Insights support insurance executives in strategically:
As an example: if analytics pinpoint a region with prolonged claim settlement times, leadership may target operational processes and implement improvements to resolve claims faster.
Power BI enables insurance businesses to work with claims data in a way that operationalizes claims to improve efficiency, lower claims work, and enhance customer satisfaction.
In addition to risk and claims management, insurance executives have to consider business development and customer loyalty. Tracking KPIs provides leadership with insights into how the organization is doing in various business dimensions.
Executives can use Power BI to monitor growth rates via live dashboards.
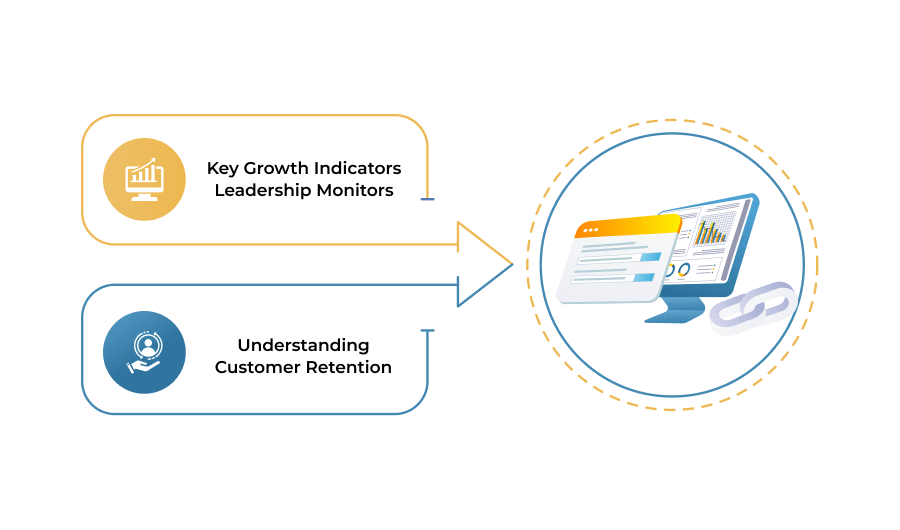
Key Growth Indicators Leadership Monitors
Power BI dashboards can show:
These insights show leaders which strategies propel growth.
Understanding Customer Retention
Insurers can leverage Power BI to understand:
This information is key for Power BI users to develop customer engagement and retention strategies.
In the fast-paced world of the insurance sector, making decisions quickly prevents lost chances, added risks, and stagnant growth. Insurance executives are required to act swiftly regarding shifts in the behavior of customers, the patterns of claims and the market’s behavior.
With real-time data, predictive analysis, and interactive dashboards, Power BI makes it possible for leadership teams to act strategically and make data-driven decisions quicker.
Business intelligence tools like Power BI help leaders better understand how to execute various business strategies. Consider decision-making examples like the following: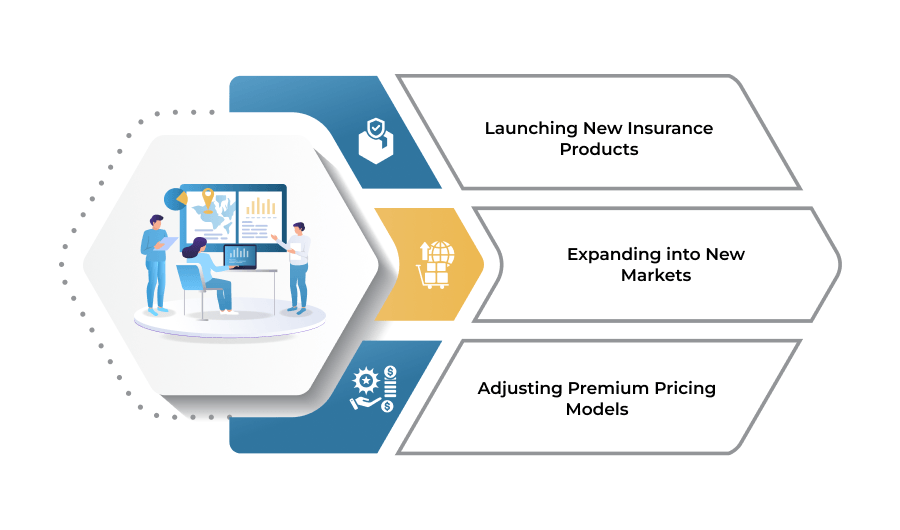
Power BI assists leaderships by providing them with the necessary data to accurately visualize different business scenarios.
Real-Time Alerts and Performance Monitoring Power BI dashboards provide the capability of automating alerts based on defined thresholds of the metrics pertaining to evaluation and performance analysis. This becomes beneficial as the leadership tiers may increase responsiveness to emerging challenges.
A few use cases may include the following: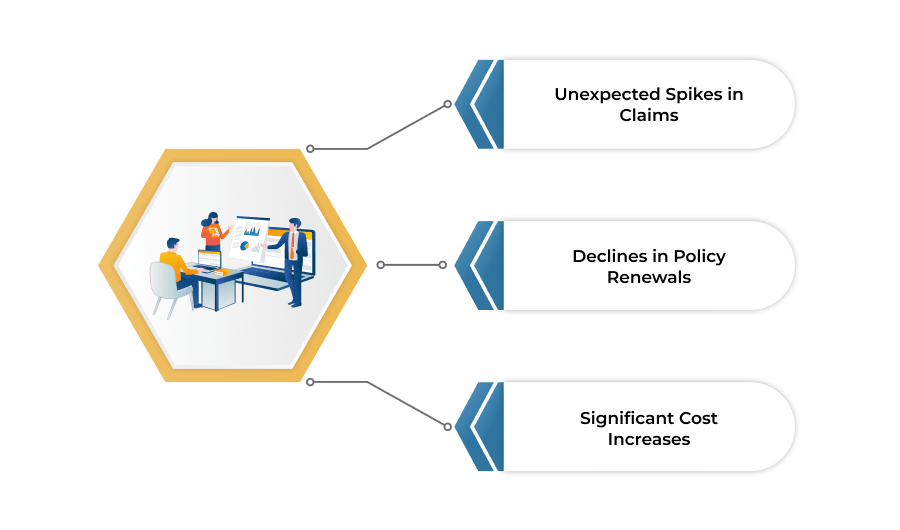
The above capabilities facilitate the transition of insurance leaders from reactive management to proactive management. This means their responsiveness to changes in the market or operational challenges is greatly improved.
Insurance is one of the most regulated industries in the world, and the leaders of these organizations must prioritize data governance, data security, and regulatory compliance for the entire organization.
Power BI assists with these responsibilities by offering strong governance capabilities.
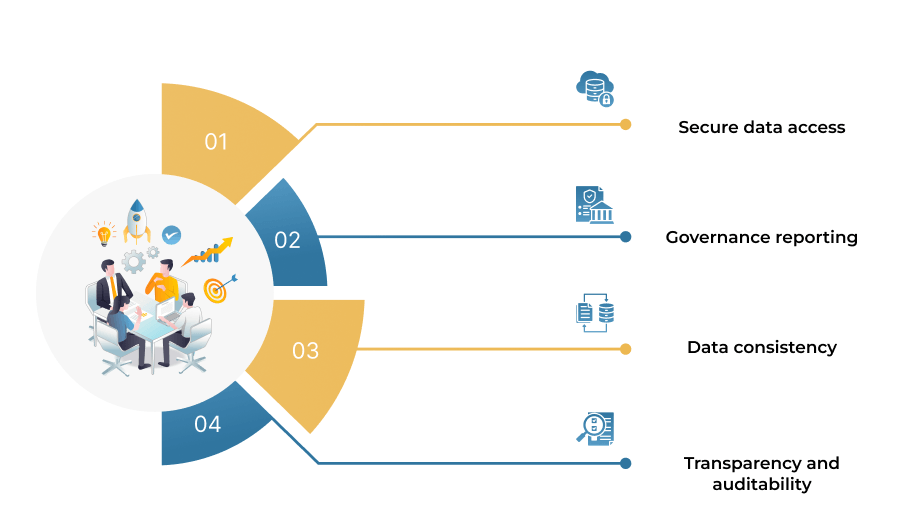
These governance capabilities make Power BI suitable for enterprise-scale insurance analytics environments.
Insurance companies can dramatically enhance their internal processes and market competitiveness by adopting Power BI analytics.
Executive teams now have the ability to access insights that were virtually inaccessible prior to the use of conventional reporting systems.
Power BI proves to be beneficial in multiple areas: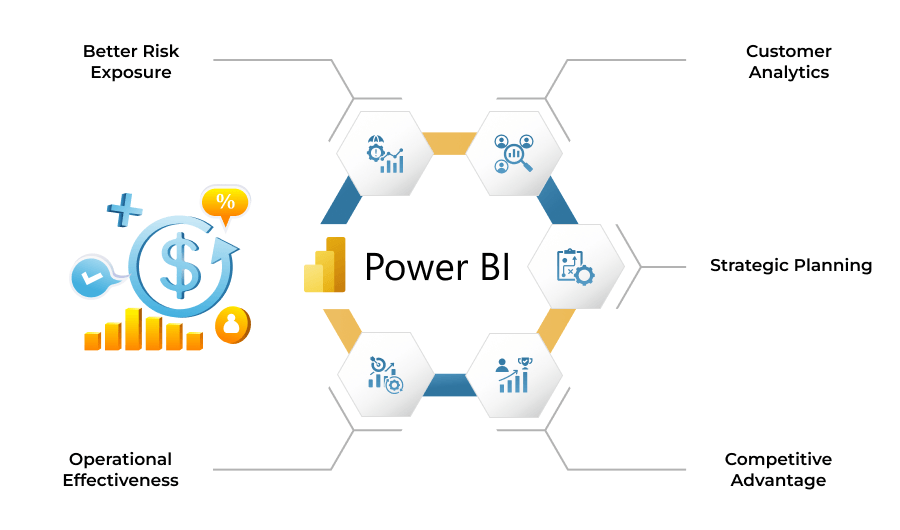
Insurance enterprises can utilize the above benefits of data in the formation of tactical business intelligence.
In light of recent developments in the insurance sector, effective use of data has become a key component of beneficial leadership, given the myriad of challenges to guide through, including but not limited to, increased threat exposure, cost of claims, risk, demands of the clientele, and changes to regulation.
Insurance industry executives can leverage Power BI to best understand how their companies are performing and how to integrate various metrics to help pinpoint and identify how claims can be better managed, how risk can be effectively monitored, and how overall, different company systems can be improved.
The use of Power BI, as opposed to other traditional analytic models, allows reinsurers to offer better service to their customers and to efficiently utilize their resources.
The competition in the insurance sector has become so driven by data analytics and the leadership it informs, that it has become integral for a company to be successful in the industry over the long term.

12 Oct 2026

08 Oct 2026
05 Oct 2026