How Can AI Help Fintech...
08 Oct 2026

Intelligent analytics is helping OEM manufacturers modernize their operations. Traditional manufacturing systems often lack real-time visibility, rely on siloed data, and respond too slowly to operational challenges. By combining IoT with advanced analytics, manufacturers can unify data, improve decision-making, reduce downtime, and increase operational efficiency.
Manufacturing oversight has been largely the catching, up phase game for decades. Managers often rely on manual reports, disconnected spreadsheets, and end-of-shift summaries to understand past production performance. It is a reactive approach that brings challenges stifling growth and draining profitability.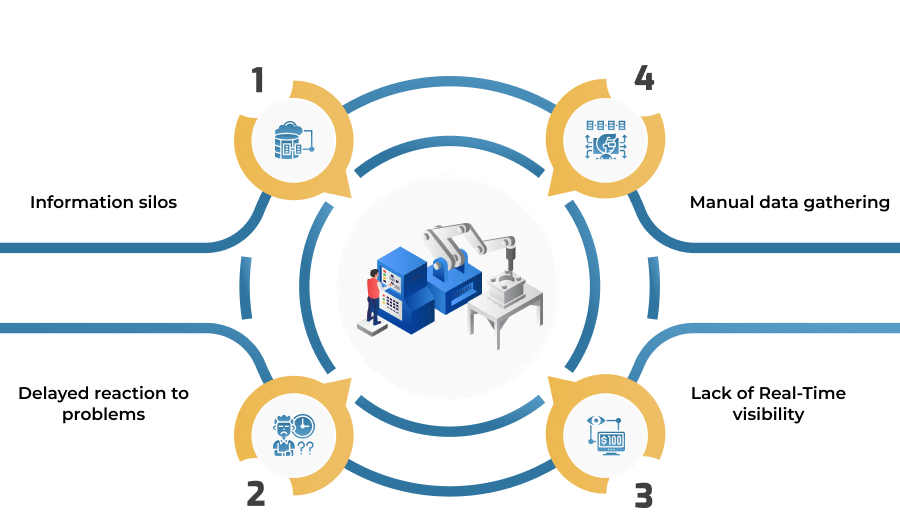
This conventional framework induces a permanent condition of confusion, which hinders OEMs from making the most of their production
The real power of intelligent analytics reveals itself when it cuts out the information silos that separate manufacturing teams. By building one single, integrated data platform, OEMs get a connected view of shop floor operations, supply chain activities, and engineering changes. This combined visibility becomes the central nervous system of the enterprisehelping each team to always have the latest real, time data and hence, drive decisions based on facts rather than on assumptions.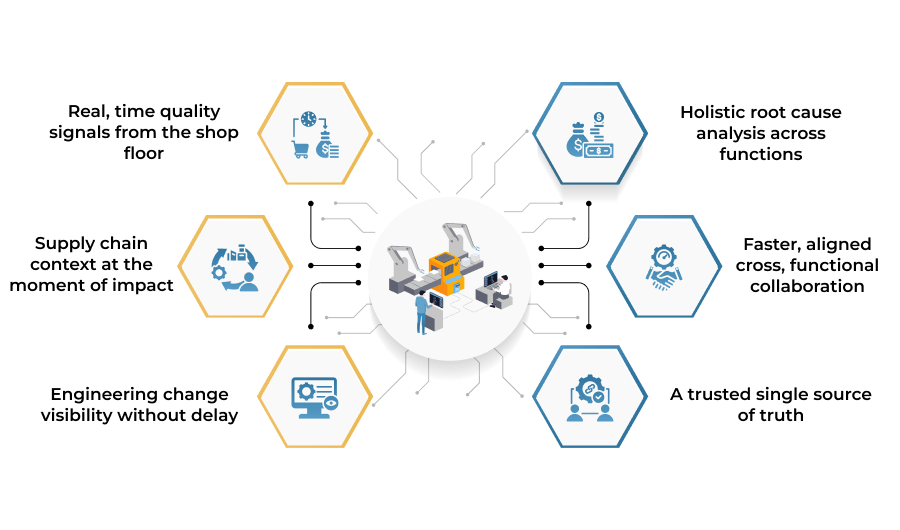
Real-Time Quality Signals from the Shop Floor:
When there is a quality problemsay the number of defects has unexpectedly risenintelligent analytics will capture the signal immediately. It eliminates the need for teams to rely on the reports or inspections as they get alert notifications anyway happening in real, time, which means that they will be able to conduct the investigations and implement corrective actions without delay.
Supply Chain Context at the Moment of Impact:
It is analytics that, automatically, through the correlation of the issues on the shop floor with the supply chain data, can point out whether the problem arose from a new supplier, raw material batch, or a variation in deliverythus, supplier insights are brought straight to operational decision, making.
Engineering Change Visibility Without Delay:
Any engineering updates at the last momentwhether new process instructions, design changes, or tolerance adjustmentsare directly open to view. Through the connection of PLM data with production results, the two aspects can be mapped so that it is understood whether the defects are caused by process execution or specification changes.
Holistic Root Cause Analysis Across Functions:
When all data are linked, root cause analysis that is thorough is not fragmented. The problems are not labeled as merely “shop floor problems” but are assessed from quality, supply, and engineering perspectives for precise diagnosis.
Faster-Aligned Cross, Functional Collaboration:
Quality, operations, and engineering teams are able to pinpoint tQuality, operations, and engineering teams are able to pinpoint the same facts together and this promotes their collaboration. The teams can focus more on the data and less on opinions which leads to quicker decision, making.
A Trusted Single Source of Truth:
Combining operational data, smart analytics creates an accurate single source of truth that is reliable. It also prevents recurring problems, enhances accountability, and thus, turns into proactive problem prevention rather than repeated firefighting.
In order to operate a consolidated analytics platform, automakers require a steady flow of accurate data directly obtained from the source (the factory floor). The Industrial Internet of Things (IIoT) is one of the main ways the factory floor can be enabled.
Manufacturers can use IIoT to make equipment, production lines, and even work, in, progress smart and connected, by using sensors and communication networks.
Those smart devices are like the factory’s digital senses that are always open, collecting signals from production that were before invisible or hard to measure. Examples include: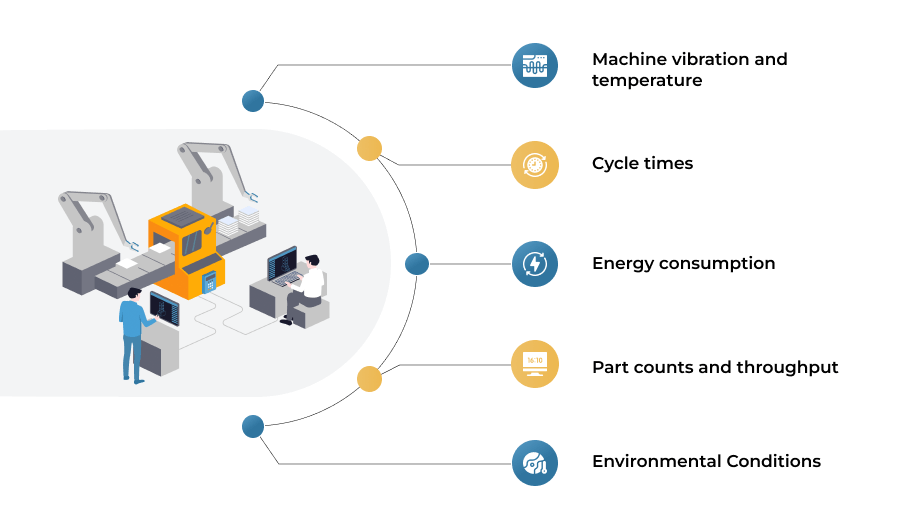
Firstly, whenever these IoT, enabled devices are networked to a cloud or a local data repository, manufacturers can record a massive amount of data points daily. Secondly, this abundant raw data stream is what really propels smart analyticsthe conversion of factory floor activities into digital information that can be scrutinized, forecast, and perpetually improved.
Gathering large quantities of manufacturing data can only be beneficial if the teams involved are able to visualize, analyze, and make decisions based on the data. Modern business intelligence tools such as Microsoft Power BI play a major role here. Power BI changes unprocessed and complicated data into understandable and workable insights. It substitutes static, old, fashioned Excel reports with interactive, live dashboards which accelerate decision, making.
An efficient Power BI manufacturing dashboard offers a quick overview of essential operational KPIs, such as: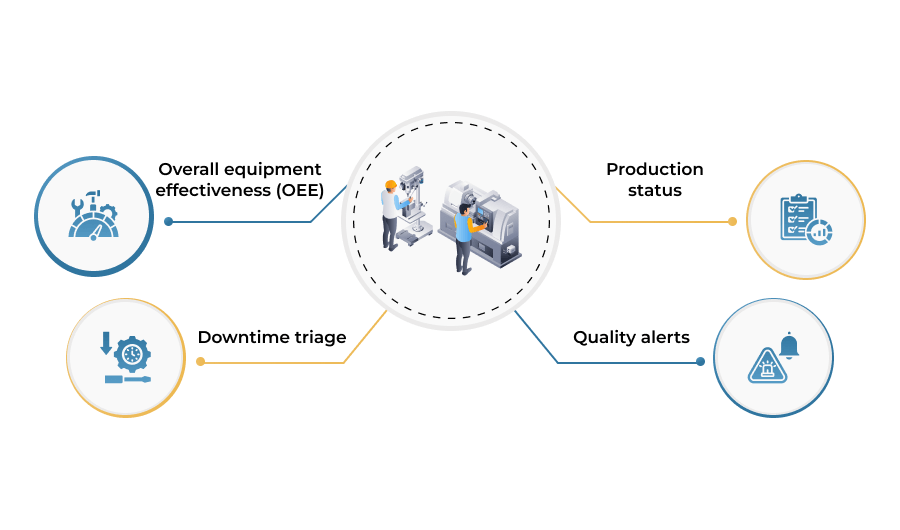
This degree of transparency re, establishes the control in hands of operations leaders. A plant manager can stroll down the factory floor, look at a Power BI dashboard on a big screen, and immediately understand where to focusbe it solving a bottleneck, fixing a quality concern, or leveraging a chance for improvement.
The most significant change that smart analytics bring is the power of going beyond current situations to forecast future ones. This move from descriptive to predictive and prescriptive analytics represents that great leap.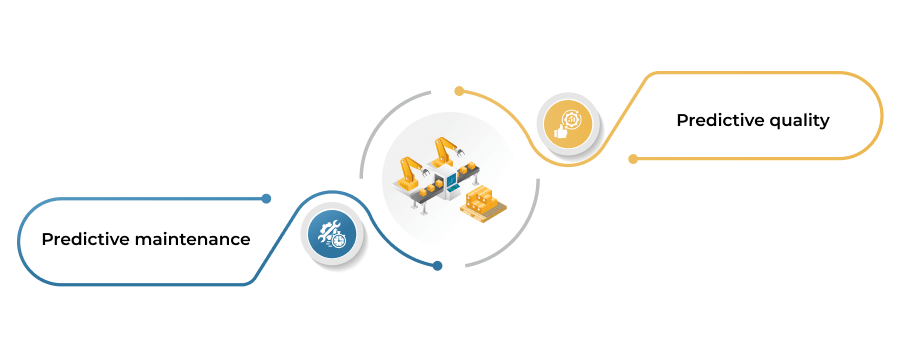
Predictive models analyze historical and real, time sensor data instead of following a fixed schedule (which may result in unnecessary parts replacement) or running to failure (which leads to catastrophic downtime). These models can predict, by detecting subtle changes in vibration, temperature, or power draw, that a specific component, for example, a motor bearing, is going to fail within the next three weeks. Deloitte states that predictive maintenance can reduce downtime by 50% and increase the lifespan of the machine by 20-40%. This in turn enables maintenance scheduling just, in, time, therefore minimizing disruption and maximizing asset availability.
In the same way, analytics can forecast quality issues before they happen.When different process parameters variants (e.g., machine speed, tool temperature, raw material batch number) are combined with the final quality inspection results, machine learning models can find the “golden recipe” for a flawless part.Once the system identifies a process change that has always resulted in a defect, it can notify the operator to change a machine parameter or even stop the production line for an inspection.This moves quality control from being a final inspection checkpoint to an in, process, proactive control, thus greatly lowering the costs of scrap and rework.
The main target of every OEM is to enhance their operational and financial performance. Intelligent analytics is the key driver of those metrics that have the greatest impact on the bottom line.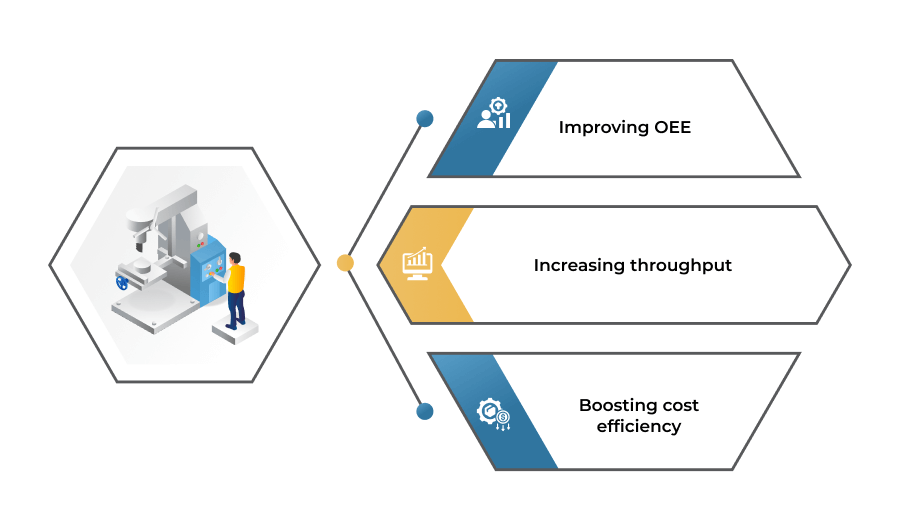
In the case of a multi, site OEM, the challenge probably increases exponentially. How can you make sure that the best practices, which your German plant has developed, are implemented at your Mexican plant? How do you consistently benchmark the performance of your various locations?
Smart analytics is the backbone for scaling success. A single analytics platform, receiving data from all the plants, creates a uniform model for operational performance. Metrics such as OEE, downtime, and first, pass yield are standardized and measured in the same way globally. That gives the benefits of: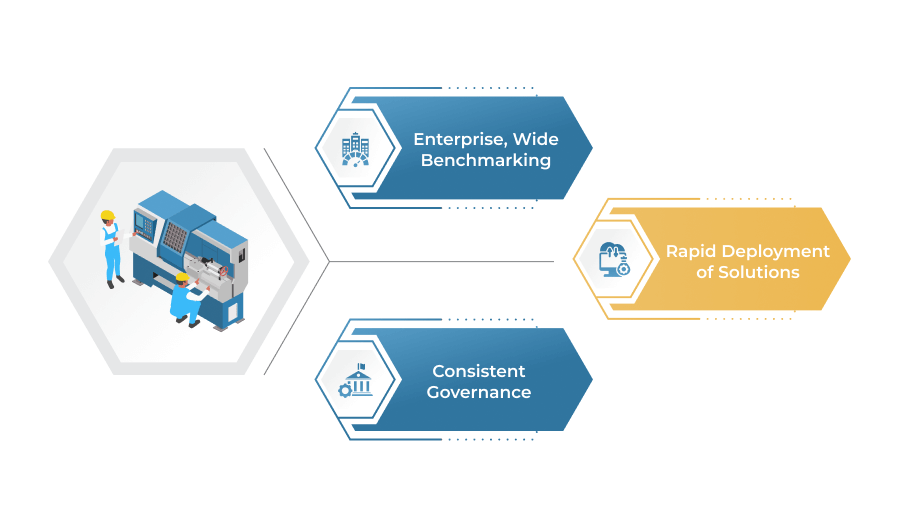
Great data requires strong governance. Without a solid governance framework, analytics projects can quickly become difficult to manage. Data trust is essential for success. Decision-makers rely on data only when they trust its accuracy and consistency.
A strong data governance strategy for manufacturing includes: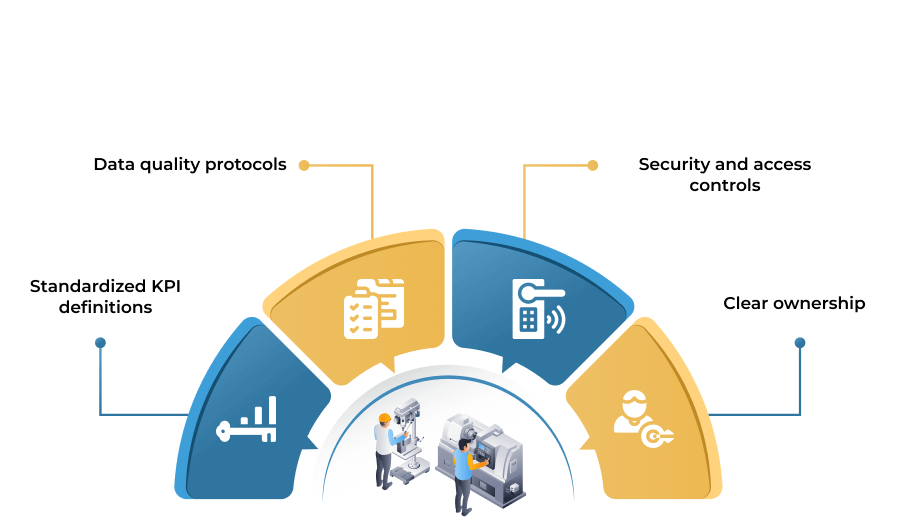
These governance practices make insights accurate, consistent, and reliable. As a result, organizations can confidently make data-driven decisions and build a strong data-driven culture.
The time of intuition-based manufacturing is over. Intelligent analytics has become a core business capability for OEMs competing in complex global markets.
Manufacturers can transform their operations by connecting the shop floor with executive decision-making. They can achieve this through IoT data collection, predictive analytics, and real-time insights.
This approach helps reduce unexpected downtime, improve product quality, and maximize the value of every asset. It also strengthens operational efficiency across the organization.
OEMs that embrace data-driven manufacturing will do more than overcome today’s challenges. They will build agile, resilient, and intelligent operations that support long-term growth and future competitiveness.

08 Oct 2026
05 Oct 2026
01 Oct 2026