Why Today’s Customers Expect Insurance...
12 Oct 2026

With Microsoft Power BI and Microsoft Power Apps, businesses can further digitize and streamline quality management by incorporating real-time data collection, advanced analytics, and dynamic reporting. Power Apps allows agencies to build mobile apps to gain quality data from employees on the shop floor, to dramatically minimize the chances of human error and data loss.
Also, Power BI can translate this data into advanced dashboards for visualizations and interactive intel that allows agencies to observe trends of defects and causes of quality harms, as well as track quality KPIs across the different levels of their operations. Collectively, these apps enable enterprises to digitize and simplify their operations while maintaining process efficiency, compliance, and process quality, with an added level of transparency and data safety.
Many production-oriented businesses focus on developing and manufacturing products in large numbers and may still rely on traditional methods of monitoring quality. All these result in slow decision making processes, poor operation visibility, increased operational risks, and overall inefficient processes. Ensuring constant quality in complex production environments without the use of real-time data, automation, and integrated systems tends to be extremely difficult. As competition increases along with partner and customer expectations the limitations of businesses operation become intolerable real-time impacts on business performance and even brand reputation.
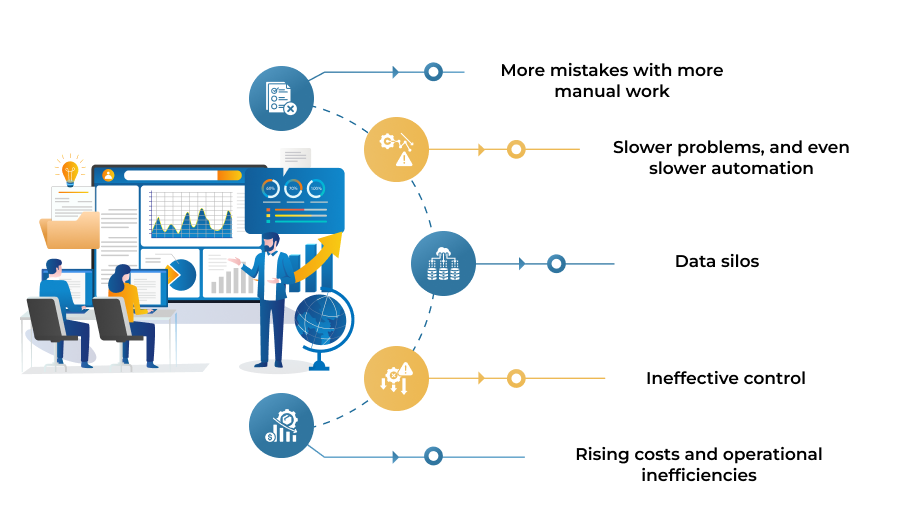
More Mistakes with More Manual Work
More manual data entry increases the risk of human error. As a result, organizations create incomplete and inconsistent records. Paper-based documentation and spreadsheets also increase the risk of losing critical information. Poor data quality makes it difficult to track quality issues accurately and support data-driven decisions.
Data Silos
Quality data often exists across production, inspection, enterprise resource planning (ERP), and other manufacturing systems. Without cross-functional data access, teams struggle to gain a complete view of quality performance. This lack of visibility delays decision-making and reduces operational efficiency.
Slower Problems, and Even Slower Automation
Effective reporting should identify multiple quality issues quickly. However, small operational delays can create production bottlenecks and hidden performance losses. Slow processes increase the number of unresolved issues and delay corrective actions. As a result, manufacturers lose valuable production time and product quality suffers.
Ineffective Control
Managing quality becomes more difficult when systems cannot consolidate related quality issues into a single view. Teams often respond to problems individually instead of addressing the root cause. This reactive approach increases downtime and limits overall production efficiency.
Rising Costs and Operational Inefficiencies
Failing to detect defects early creates additional production challenges. Manufacturers spend more time correcting errors, waste more materials, and process more warranty claims. Production delays also reduce customer satisfaction and increase operating costs. Over time, poor quality affects profitability, competitiveness, and long-term business growth.
To overcome the inefficiencies in their operations, businesses are rapidly shifting towards digital options, such as Microsoft Power Apps, to build custom applications to collect quality data directly on the shop floor in real time.
Key capabilities include:
A quality inspector, for instance, may log a defect in the Power Apps mobile app while walking the floor to capture production. Power Apps eliminates the erroneous capture of data at the source and reduces the capture of data after production, thus meaning the capture of inspection data is accurate.
In a short span of time and with little effort, businesses are expected to collect quality data for analysis.
Once quality data is captured the immediate task is to analyze and visualize it in an efficient manner. Microsoft Power BI’s innovative dashboards breakdown raw data and provide interactive and visual insights that lead to Real-time and better decision making.
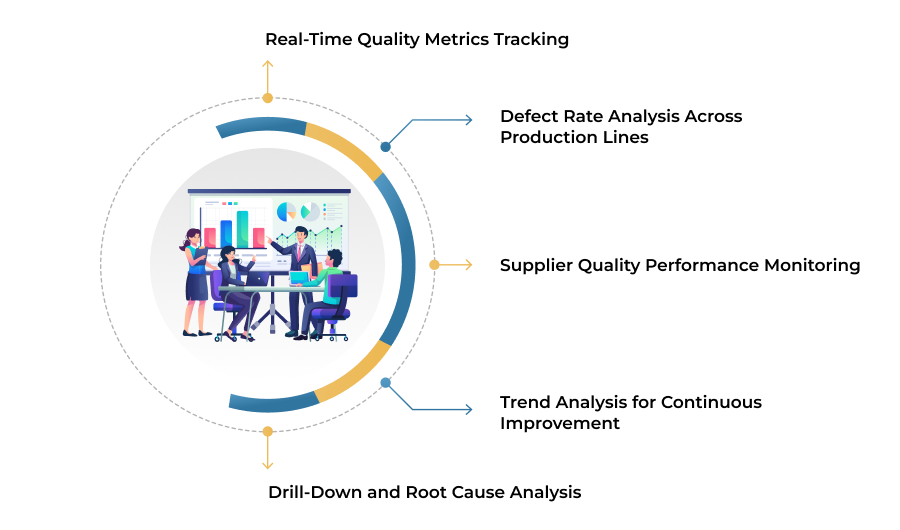
Power BI dashboards enable stakeholders to see objective quality performance from all lines of production. This helps in identifying potential quality issues across production lines, correcting quality issues gaps on a much faster scale and sustaining the quality of production across all lines.
Identifying defect patterns is transforming today’s manufacturing industry. For example, with the right tools such as Microsoft Power BI, businesses can look beyond basic reporting to discover the hidden inefficiencies present throughout the production lifecycle. Intelligent analytics platforms are helping manufacturers uncover hidden patterns and optimize production performance.
Once quality defects are discovered, companies can study the historical data to create reports showing the frequency of the discovered defect over a number of shifts, production runs, or production lines. Staff are able to address the most significant quality problems as a result..
Advanced analytics offers a framework for identifying important relationships with regard to machine settings, raw material, operators, and at the same time identifying the root cause and the corrective action to minimize the consequence.
Predictive analytics take this a step further, allowing companies to anticipate defects and take preemptive action to minimize costs and waste and promote the quality of output. This transforms quality management from a reactive to a strategic advantage.
In manufacturing, measurement critical for improvement. Quality KPI tracking across production lines is more than reporting. Real-time control over performance, optimized variability, and meeting product standards are achieved as KPI reporting evolves.
Microsoft Power BI dashboards offer clarity across complex quality data. Dashboards are readily available at any time, from any location.
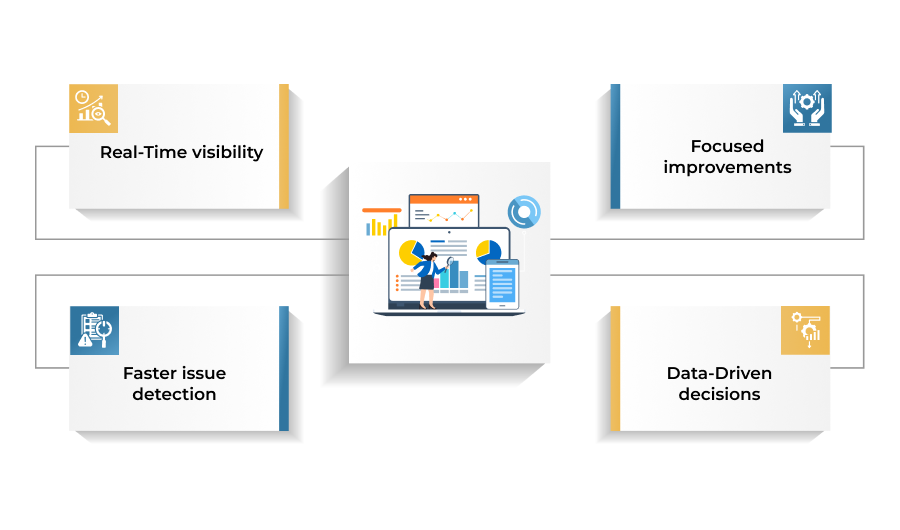
Imagine a sudden spike in scrap rate on a specific production line. Instead of discovering it days later, managers can detect it instantly through dashboards, investigate the root cause, and take immediate corrective action. Digital-first strategies are helping manufacturers solve operational challenges with faster, insight-driven execution.
This level of responsiveness not only reduces waste and downtime but also improves operational efficiency, ensures consistent quality, and strengthens overall business performance.
Measuring the quality management benefits from Microsoft Power Apps and Microsoft Power BI shows that these solutions deliver measurable improvements across manufacturing operations. They help organizations reduce costs, improve quality, and streamline compliance.
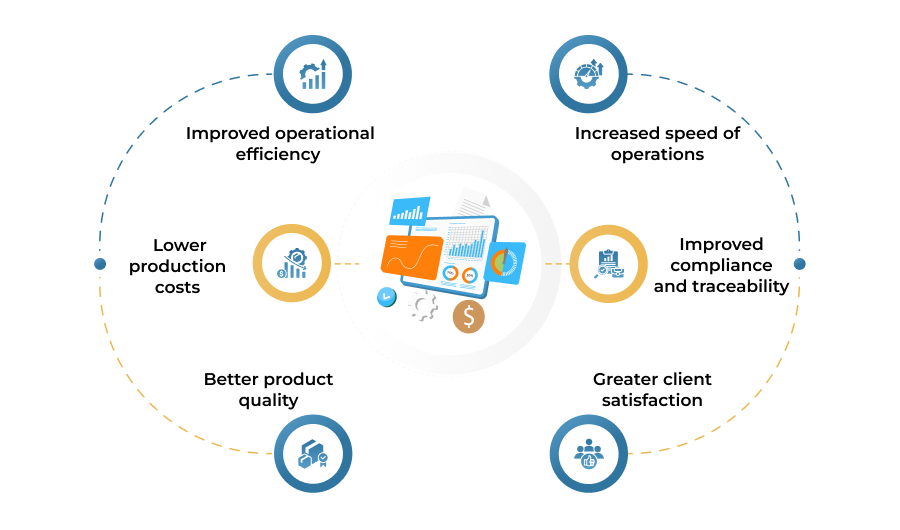
Quality management analytics helps manufacturers improve efficiency, reduce costs, enhance product quality, and maintain regulatory compliance. By analyzing production data in real time, organizations can identify quality issues early and make faster, data-driven decisions.
1. Improved Operational Efficiency
Quality management analytics and monitoring reduce labor-intensive tasks and eliminate workflow bottlenecks. They streamline reporting processes and improve overall productivity. As a result, employees can focus on higher-value activities and continuous process improvement. Manufacturing organizations often report productivity gains of 20% to 30% after implementing quality management analytics.
2. Lower Production Costs
Better quality analytics help manufacturers detect defects early in the production process. Early detection reduces waste, rework, scrap, and warranty claims. Effective quality management also supports sustainability initiatives by optimizing material and resource usage. These improvements significantly lower overall production costs.
3. Better Product Quality
Quality management analytics improves production consistency and stabilizes manufacturing quality. It helps identify defects before products reach customers. As a result, organizations reduce customer complaints and improve product reliability. Many manufacturers achieve a 30% to 50% improvement in defect reduction through advanced quality analytics.
4. Increased Speed of Operations
Real-time quality insights enable manufacturers to identify and resolve production issues faster. Teams can make informed decisions without waiting for manual reports. This improves production flow and allows organizations to prevent quality issues up to five times faster.
5. Improved Compliance and Traceability
Digital quality management systems centralize production data and improve traceability across manufacturing processes. These systems simplify regulatory compliance, internal audits, and documentation. Companies that digitize quality management often report 30% to 40% better compliance tracking and greater operational transparency.
6. Greater Customer Satisfaction
High-quality products reduce customer complaints, product returns, and warranty claims. Consistent product quality also strengthens customer trust and brand reputation. As a result, manufacturers can increase customer retention by 10% to 15% while building long-term customer loyalty.
Modern manufacturers face increasing pressure to improve product quality while reducing operational costs. Quality management analytics provides real-time visibility into production performance, enabling organizations to identify risks, improve decision-making, and optimize manufacturing processes. By adopting data-driven quality management systems, manufacturers can increase efficiency, strengthen compliance, reduce waste, and deliver a better customer experience.
Integration of quality data systems is a known business advantage. However, there are several, sometimes counter, challenges, which if not managed properly, can delay or stall the digital transformation journey.
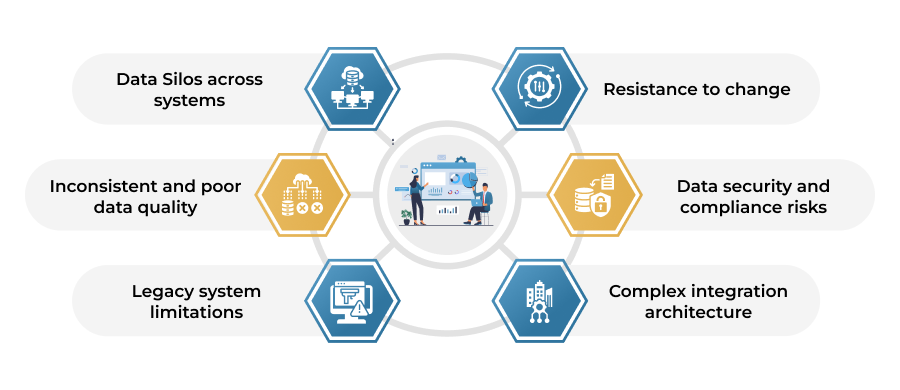
It is, therefore, of utmost importance, to take into considerations the standard of data, quality, and the importance of a seamless and transparent digital solution, especially for cloud systems. Only then, real data quality intertwined with the business systems and data would be possible. Data, clearer visibility, and quality in true sense.
Quality management systems are being enhanced by new capabilities driven by Artificial Intelligence. Modern businesses are using advanced analytical tools such as Microsoft Power BI to implement real-time analytics and predictive analysis leading to improved automation of decision-making processes.
AI based analytics remains predictive which causes a drop of defect percentage by 30-50% with an accompanying decline of associated production risks. The Internet of Things (IoT) based systems bring real-time monitoring of productivity with connected sensors. The net result is an increase in the productivity and efficiency by 20-30% along with decreased times to identify issues.
Digital twins, more recently the automated root cause analysis, have the potential to shift the starting point of manufacturing disruptions processes. Digital twins can increase efficiency by as much as 25% and root cause analytics can reduce the time to average troubleshooting to less than 30%.
As quality systems become more integrated, the autonomy of systems detecting and predicting issues then recommending corrective actions will be the new paradigm. The ultimate result will be improved efficiency, reduced operating costs, and enhanced product quality.
Quality management has evolved from manual inspections to a data-driven strategy focused on real-time insights and continuous improvement. Modern enterprises need intelligent systems that provide visibility across the entire production lifecycle, enabling faster and more accurate decision-making.
By using Microsoft Power Apps for data collection and Microsoft Power BI for analytics, organizations can create a connected quality ecosystem. This integration ensures seamless data flow, improves transparency, and empowers teams with actionable insights.
As a result, businesses can reduce defects, control costs, and maintain consistent product quality. Data-driven quality systems not only improve operational efficiency but also help organizations stay competitive, enhance customer satisfaction, and achieve long-term success.

12 Oct 2026

08 Oct 2026
05 Oct 2026