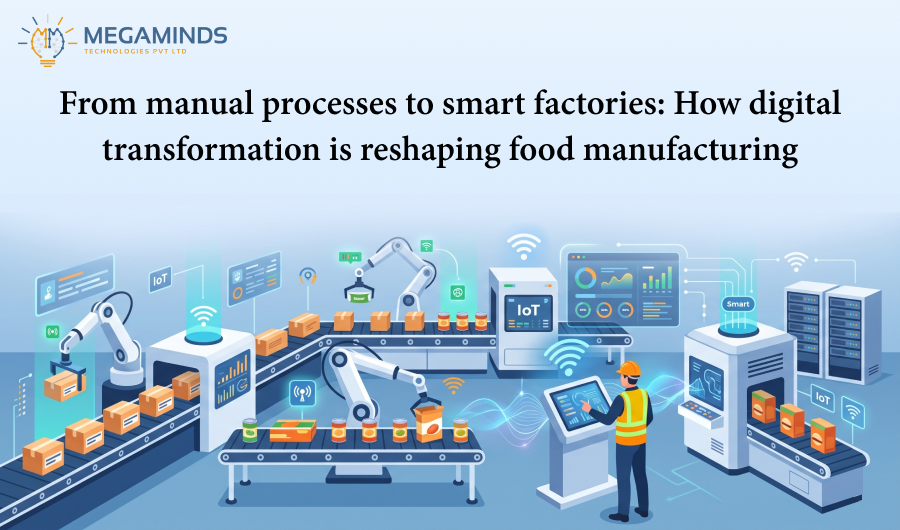
From Manual Processes to Smart...
22 Oct 2026


Reverse logistics-the process of managing products as they move backward through the supply chain-has undergone a major transformation, from being considered a back-office activity to becoming a major business issue. With the growth of online shopping, this return volume is also explosively increasing, throwing tremendous operational challenges at different businesses across industries. For many retailers and manufacturers, being able to manage returns properly can mean the difference between profit and loss.
The return journey has to be as convenient as the buying one for today’s customers. Behind that chic and seamless experience lies a complicated mesh of processes many companies are hard-pressed to even time-optimizing. This is where Power BI analytics comes into play-in transforming the way companies manage, analyze, and optimize their reverse logistics operations.
Today, reverse logistics functions as a massive bottleneck that generates uncertainties, thereby sowing inefficiency into an operating network that extends throughout the entire business. The major challenges originate from many critical factors that deter smooth operation.
Conventional supply chains, in essence, cater to the movement of goods in one direction-from the manufacturer to the customer-in a somewhat linear fashion. The reverse wills: if goods move in reverse, they quickly hit hard upon a system that is far from being adaptable to such opposing flows. This unpredictability of returns further increases the dilemma since it becomes difficult to plan resources accordingly.
The complexity arises when considering that every one of the returns has an inspection, sorting, and routing decision to make. Rather than forward logistics, where products take a predetermined path, returns require an individual judgment about what to do with each item-that is, whether to keep it, refurbish it, recycle it, or throw it away.
In addition to that, many businesses still use manual ways for returns management, causing further delays and errors. “Most retailers consider most of the time spent on manual returns processing to be their biggest challenge”. The problem only worsens with an increase in the volume of returns, this system can hardly be sustained.

Transporting returns gives rise to several charges usually lost sight of mainly, those are charges of shipping goods back to the warehouse. Yet in some cases, goods may be further transported toward repair centers, recycling facilities, or secondary markets. When a company is dealing with high return volumes, these transport charges would build up rather quickly, especially when their return logistics are inefficient.
Upon arrival at the warehouse, the returned goods have to be received, inspected, sorted, and processed all involving labor costs. These costs rise in case the processes are held manually rather than automatically.
Return goods use up warehouse space while awaiting processing and disposition decisions. This ties capital and creates more storage costs. This inventory depreciation is a big hidden cost of returns.
Dealing with a particular variety of customer questions concerning return policies, status of processing, and refund demands customer service resources. These operational costs scale, so to speak, with the volume of returned goods and the complexity of the handling process. Poor return experiences will also precipitate extra customer service interactions, value-adding further to these costs.
Opportunity costs underlie the mechanization of this inefficient returns process. Slow processing equals slow restocking-very often so slow, in fact, that another sales opportunity, especially for seasonal goods or items in heavy demand, may be lost. Inability to timely identify return patterns also allows product grounds to remain marked for issues-meaning more returns.
The returns experience greatly shapes the perception that customers have towards your brand. Studies point out that 90% of the customers will return to the merchant if the return process is simple and smooth. Yet any disruptions could create a permanent fracture of relations between the company and its customers, and that is a big opportunity cost in the highly competitive retail environment today.
As companies evolve, returns normally increase in proportion. In the absence of efficient systems, the companies constantly have to allocate more resources to deal with managing returns-a huge forsake to operational bottlenecks-pre-determining their growth. Such inefficiencies are most encountered during seasonal peak periods when returns rates go well beyond usual capacity.
A poor returns management system usually results in higher rates of product disposal, leading to environmental waste. There is an increasing consciousness among consumers about sustainability practices, such inefficient returns processes-that contribute to unnecessary disposal-can mar the brand and contradict corporate sustainability goals.
At the end of the day, all these things affect financial performance. Increased operating costs, inventory write-downs, and customer churn are few of the direct impacts on profitability. Industry data for 2023 indicate that U.S. retailers had $743 billion for merchandise returns, which is equivalent to 14.5% of total retail sales. This return-check size in dollars makes the meaning of returns optimization on top of any strategic agenda for most retail executives.
Power BI offers transformative capabilities to convert reverse logistics from a cost center into a strategic advantage. Using power data visualization and analytics, companies can increase efficiency and generate beneficial insight from the returns process.
Power BI creates consolidated dashboards that maintain real-time visibility into key metrics of returns. Through these dashboards, management can examine critical KPIs: returns volume, returns processing, disposition rate, and value recovery. So, with the immediate visibility, the teams are allowed to identify bottlenecks, allocate resourcing, and make decisions based on the then-current condition rather than from a report of past events.
Analytics in Power BI help businesses identify return patterns that might otherwise go unnoticed. By looking at returns through various lenses-product, category, region, and customer segments-companies can identify the precise root causes behind returns and address them accordingly.
These days, predictive Power BI allows enterprises to return from reactive handling of returns. Along with trends related to seasons, promotional calendars, and product attributes, returns history is analyzed for better predictability of volumes of returns.
This prediction allows the organization to move ahead with resource planning, ensuring that an adequate number of staff, space, and process capacity are allocated to cope with returns in an efficient manner.
Power BI really performs in helping to measure the financial impact that returns have variedly. Companies can perform an analysis of the actual costs of returns by product, category, channel, or customer segment. This kind of granular financial analysis helps in choosing the improvement initiatives from the standpoint of their ROI and profit impacts.

Using Power BI Analytics for returns management, companies can identify inefficiencies and bottlenecks throughout the returns process chain. Through analyzing processing times, handling costs, and disposition decisions, companies can streamline their workflows and eliminate bottlenecks. With this optimization in place, the returns spend less time in processing, allowing for quicker inventory recovery and refund processing.
Data-supported returns management provides for a highly refined custom segmentation by behaviors in returns. Power BI would help to locate different customer segments-from those irregular but legit returns to serial returners who drain profitability.
Power BI analytics can resolve disposition decisions for maximizing value recovered from returned items-instance analyses by condition data, market demand, and processing costs-allowing businesses to make much more valuable disposition decisions about whether to restock, refurbish, liquidate, or recycle returned products.
Perhaps most importantly, Power BI creates a framework for continuous improvement in returns management. By establishing baseline metrics, setting improvement targets, and tracking progress, businesses can systematically reduce return rates and processing costs over time.
With return rates averaging 16.9 percent across the industry-and considerably higher in some categories such as apparel-offline and omnichannel retailers face huge returns challenges. Power BI helps these businesses efficiently manage high volumes of returns while deriving actionable insights aimed at lowering return rates in the long run.
Power BI gives manufacturers and distributors visibility across complex reverse supply chains, to ensure optimum handling of returned merchandise, warranty claims, repairs, and recycling of parts amid the compliance with applicable regulations.
Return management 3PLs can enhance the benefit they provide to clients by offering greater visibility and analytics through Power BI, thus carving out a strong competitive advantage in the logistics market.
Companies working on sustainability and circular economy principles can employ Power BI to streamline product recovery, refurbishment, and recycling operations so as to further the cause of both environmental and economic interests by maximizing the value that can be recovered from returned products.
Reverse logistics and returns management can no longer be treated as back-office operations. With the increasing demand for transparency, efficiency, and customer-centricity, businesses must rethink how they manage returns. Power BI offers an intelligent, scalable, and actionable way to transform your reverse logistics into a strategic advantage.
By unlocking insights, reducing inefficiencies, and improving responsiveness, Power BI empowers businesses to thrive in a data-driven economy. It’s not just about fixing returns, it’s about future-proofing your entire logistics strategy.
If your organization is serious about turning logistical challenges into opportunities, Contact us today . Now is the time to invest in Power BI-powered analytics.
03 Sep 2026
17 Aug 2026
15 Jun 2026